State of NZ Garden Birds 2022 | Te Āhua o ngā Manu o te Kāri i Aotearoa
What are our garden birds telling us?
Birds keep our gardens vigorous, reflect the state of our environment’s health, and encourage people to get involved in conservation. In the 17 years the NZ Garden Bird survey has run, scientists have noticed a gradual increase in the numbers of native birds that people have seen. This is encouraging and suggests that habitat restoration and predator control initiatives are having a positive effect on our bird life.
Manaaki Whenua – Landcare Research researchers use supercomputers to distill a substantial amount of data – there have been more than 44,000 bird counts since 2012 – into simple but powerful metrics.
Thank you to all the citizen scientists who participated in the survey in 2022. It was a great turnout.
Key findings from the 2022 survey
Positive signals are emerging for four native species:
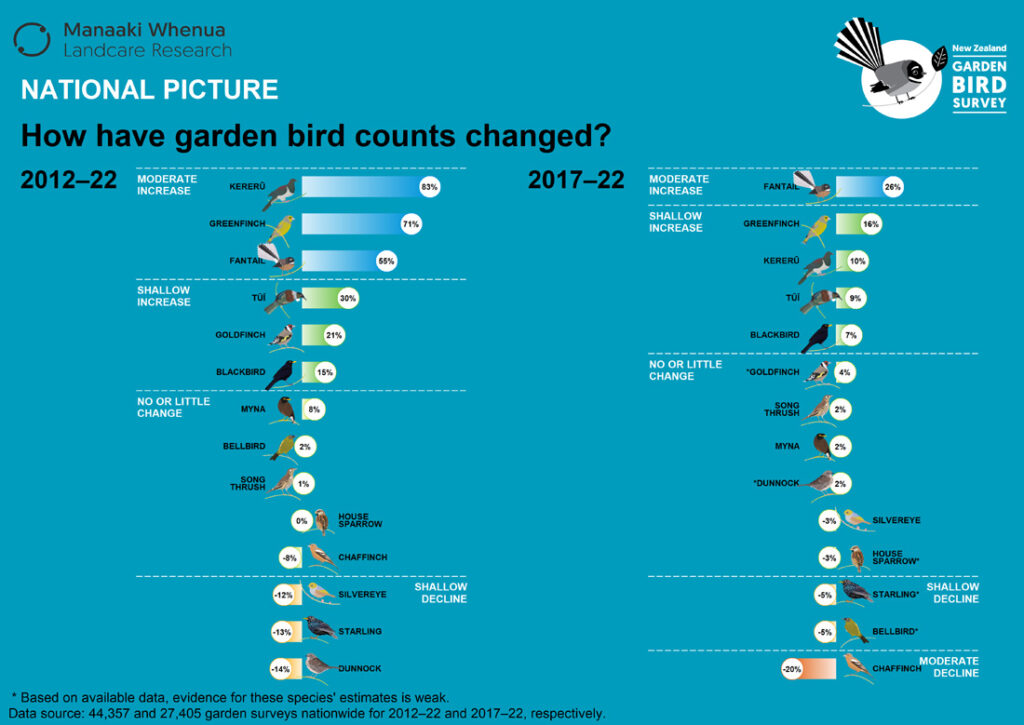
- Kererū counts show a moderate increase over 10 years (83%), with only a shallow increase over 5 years (10%).
- Fantail (pīwakawaka) counts now show a moderate increase (55%) over 10 years, compared to the shallow increase seen in recent years, and the moderate increase over 5 years continues (26%).
- We continue to see a shallow increase in tūī (kōkō) counts in the long term (30%) and short term (9%). Their regional long-term trends show a rapid increase in Canterbury (266%) and moderate increases in Taranaki (59%) and the West Coast (61%).
- There is still a long-term shallow decline in silvereye (tauhou) counts (12%), but there has been little or no change in their counts over 5 years compared to the short-term moderate increase seen last year.
Key signals for introduced species that also act as environmental indicators:
- The trend of little or no change in myna (maina) counts nationally continues, as does the trend of shallow increases in their counts in four regions over 10 years. Their counts continue to show a rapid increase in Wellington over both 10- and 5-year periods (193% and 248%, respectively), and now show a rapid increase in Manawatū-Whanganui (49%), a moderate increase in Gisborne (30%), and a shallow increase in Taranaki (12%) over 5 years.
- Starling counts again show a shallow decline over both the long and short term (13% and 5%, respectively).
- While chaffinch counts show little or no change over the long term, for the first time they show a moderate decline over the short term (20%).
If you’re keen to know more about what’s happening with garden birds in your region, reports for individual regions are available, or check out out the full State of NZ Garden Birds 2022 | Te āhua o ngā manu o te kāri i Aotearoa report.
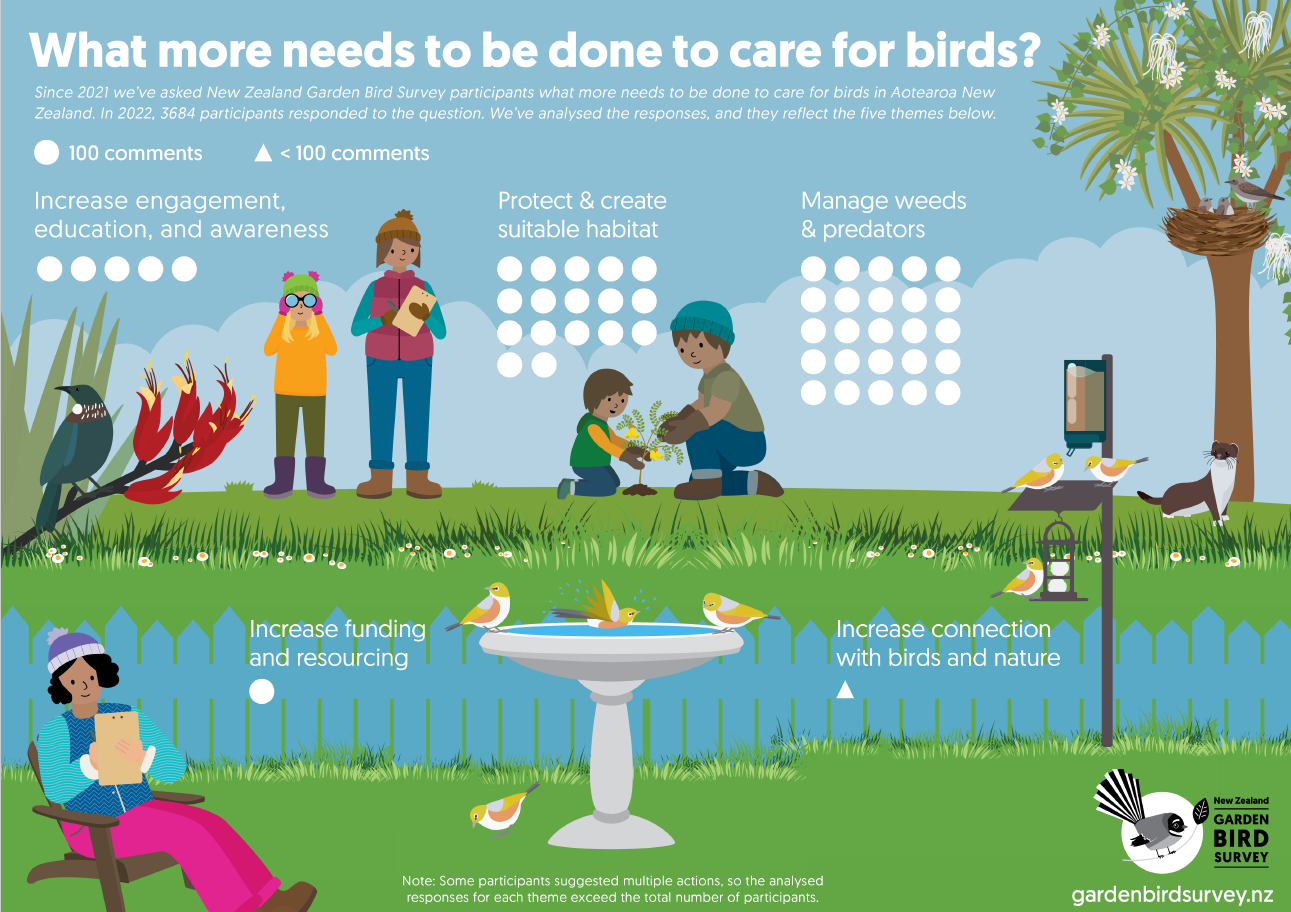
What more needs to be done to care for birds?
Since 2021 we’ve asked New Zealand Garden Bird Survey participants what more needs to be done to care for the birds in Aotearoa New Zealand. In 2022, 3684 participants responded to the question. We’ve analysed the responses, and they reflect the five themes below.
How we calculate NZ Garden Bird Survey results
The general idea behind the survey is to convert the individual bird counts people contribute into meaningful estimates of wider population changes over time. Counts from every garden surveyed are linked to their location within a neighbourhood, suburb, district and region to calculate how bird counts change over time at each of these spatial scales.
We expect a species whose population is increasing over time to show an increase in counts and vice versa. While this is simple in principle, because there are different numbers of gardens in different regions, and different people decide to participate in some years, it might appear as though bird count numbers have changed, when it is just the proportion or location of survey returns that have changed.
Cleaning ‘noisy’ data
The type of garden surveyed (rural or urban), whether people feed birds, and the total number of gardens surveyed in a region also add complexity. Statisticians refer to this as ‘noisy data’ because there are so many variables to take into account.
To reduce this noise, we use cutting edge statistical techniques to account for these variables. Following bootstrap analysis and bias-correction of the modelled data, estimated trends in bird populations over the past 5- and 10-year periods are summarised nationally and regionally according to their direction (decline or increase) and size (rapid to shallow).
These long-term trends are called ‘signals’ and show a persistent increase or decrease in the abundance of a species. We categorise these signals in the following way:

When using samples to estimate wider populations, we need some way of measuring whether the sample actually reflects the wider population. We used 80% confidence intervals for the average percentage change in each species’ counts to evaluate confidence in our estimates. We generally have more confidence at the regional level than district or suburb.
The easiest way to improve this confidence at the district or suburb level is to increase the number of bird counts done. The more people who participate, the greater the strength of our evidence for what’s happening to garden birds at the local scale.
How have bird counts changed?
Maps | Changes in species counts across regions 2022


Bar charts | Changes in species counts across regions 2022